
Bitcoin hat auf seinem Tages-Chart ein klassisches rückläufiges Muster gebildet, und wenn sich dies bestätigt, könnte ein Preisrückgang auf 56.000 US-Dollar in Sicht sein.
Key takeaways:
-
A developing bear pennant keeps a BTC price drop toward $56,000 in play.
-
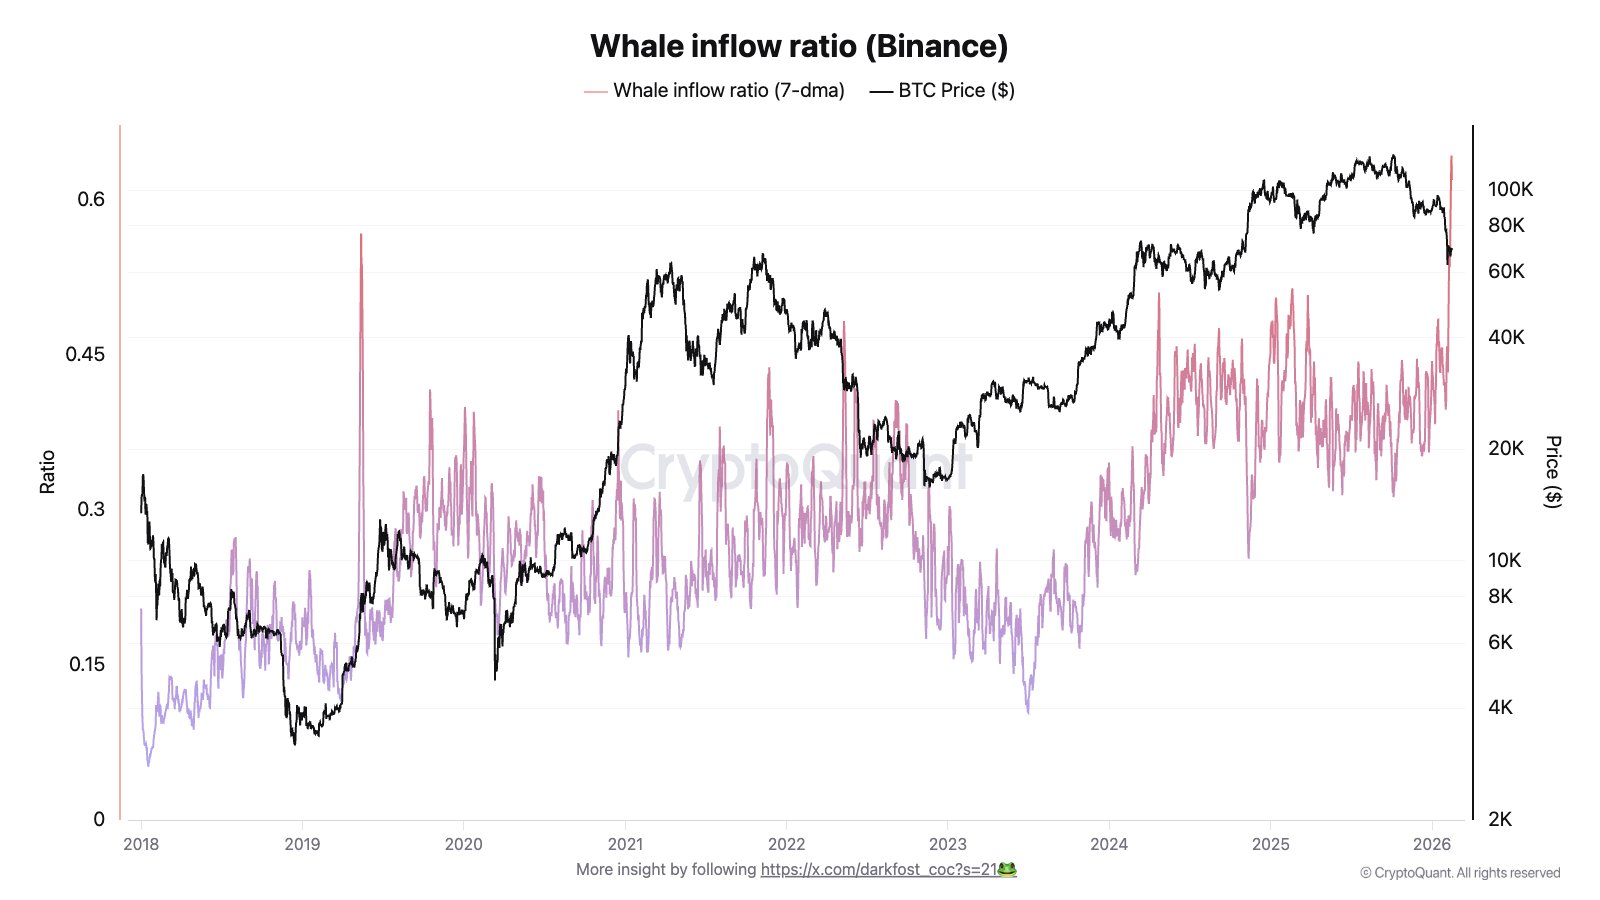
Rising whale inflows to Binance further the downside outlook.
Bitcoin (BTC) may slide deeper into February as its bearish chart structure converges with renewed whale activity on Binance.
Bear pennant setup hints at 20% BTC price decline
Bitcoin has been painting what appears to be a bear pennant setup on its daily chart.
A bear pennant pattern forms when the price consolidates inside converging trendlines after a sharp drop, called the “flagpole.” It often resolves with another leg down, roughly matching the initial decline.
On BTC’s chart, the structure emerged after the steep sell-off toward the $60,000 zone. The price has since compressed into a tightening triangle while remaining below key moving averages, signaling weak momentum.
A decisive breakdown beneath the pennant support may open the door to a move below the $56,000 mark, about 20% below the current levels, in February.
Conversely, a break above the pennant’s upper trendline, aligning with the 20-day exponential moving average (20-day EMA; the green wave) at about $72,700, may invalidate the bearish setup altogether.
Whale inflows on Binance add to bearish BTC setup
As of Tuesday, Bitcoin’s whale inflow ratio (seven-day average) had spiked to a record high of 0.619 compared with 0.40 at the month’s beginning, according to data resource CryptoQuant.
The ratio compares exchange inflows from the 10 biggest BTC transactions to total inflows. Its rise, according to Darkfost, a CryptoQuant-associated analyst, can be interpreted as rising sell-side pressure from whales.
Bitcoin’s durable bottom is near
Matrixport’s signal introduces a short-term counterbalance to the bearish setup.
As of this week, Matrixport’s Greed & Fear Sentiment Index triggered a potential bottoming signal: The 21-day moving average has dipped below zero and is now turning higher.
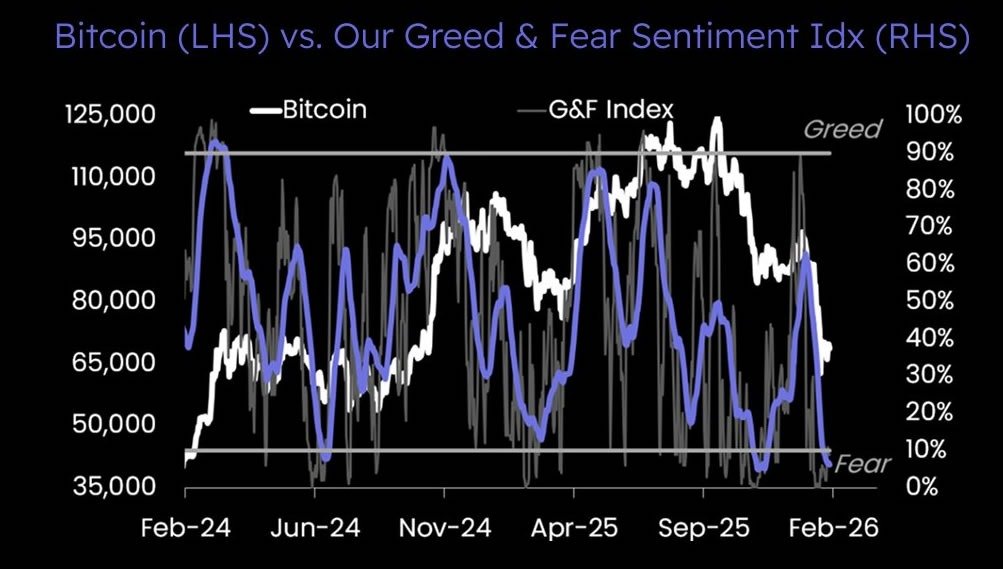
Historically, that combination has lined up with “durable bottoms,” implying sellers may be running out of momentum.
Related: Bitcoin accumulation wave puts $80K back in play: Analyst
That doesn’t rule out another flush lower, but it raises the odds of a relief bounce before any sustained breakdown takes hold.
Dieser Artikel enthält keine Anlageberatung oder -empfehlungen. Jede Anlage- und Handelsmaßnahme birgt Risiken, und Leser sollten bei ihrer Entscheidung eigene Recherchen durchführen. Obwohl wir bestrebt sind, genaue und aktuelle Informationen bereitzustellen, übernimmt Cointelegraph keine Garantie für die Richtigkeit, Vollständigkeit oder Zuverlässigkeit der Informationen in diesem Artikel. Dieser Artikel kann zukunftsgerichtete Aussagen enthalten, die Risiken und Unsicherheiten unterliegen. Cointelegraph haftet nicht für Verluste oder Schäden, die sich aus Ihrem Vertrauen auf diese Informationen ergeben.