
Der RSI von Bitcoin nähert sich einem Schlüsselniveau, wobei Analysten sagen, dass ein höheres Tief erforderlich ist, um eine mögliche Fortsetzung des BTC-Preises zu unterstützen.
Bitcoin (BTC) is signaling a potential long-term bottom as a key leading indicator prepares for a higher low.
Key points:
-
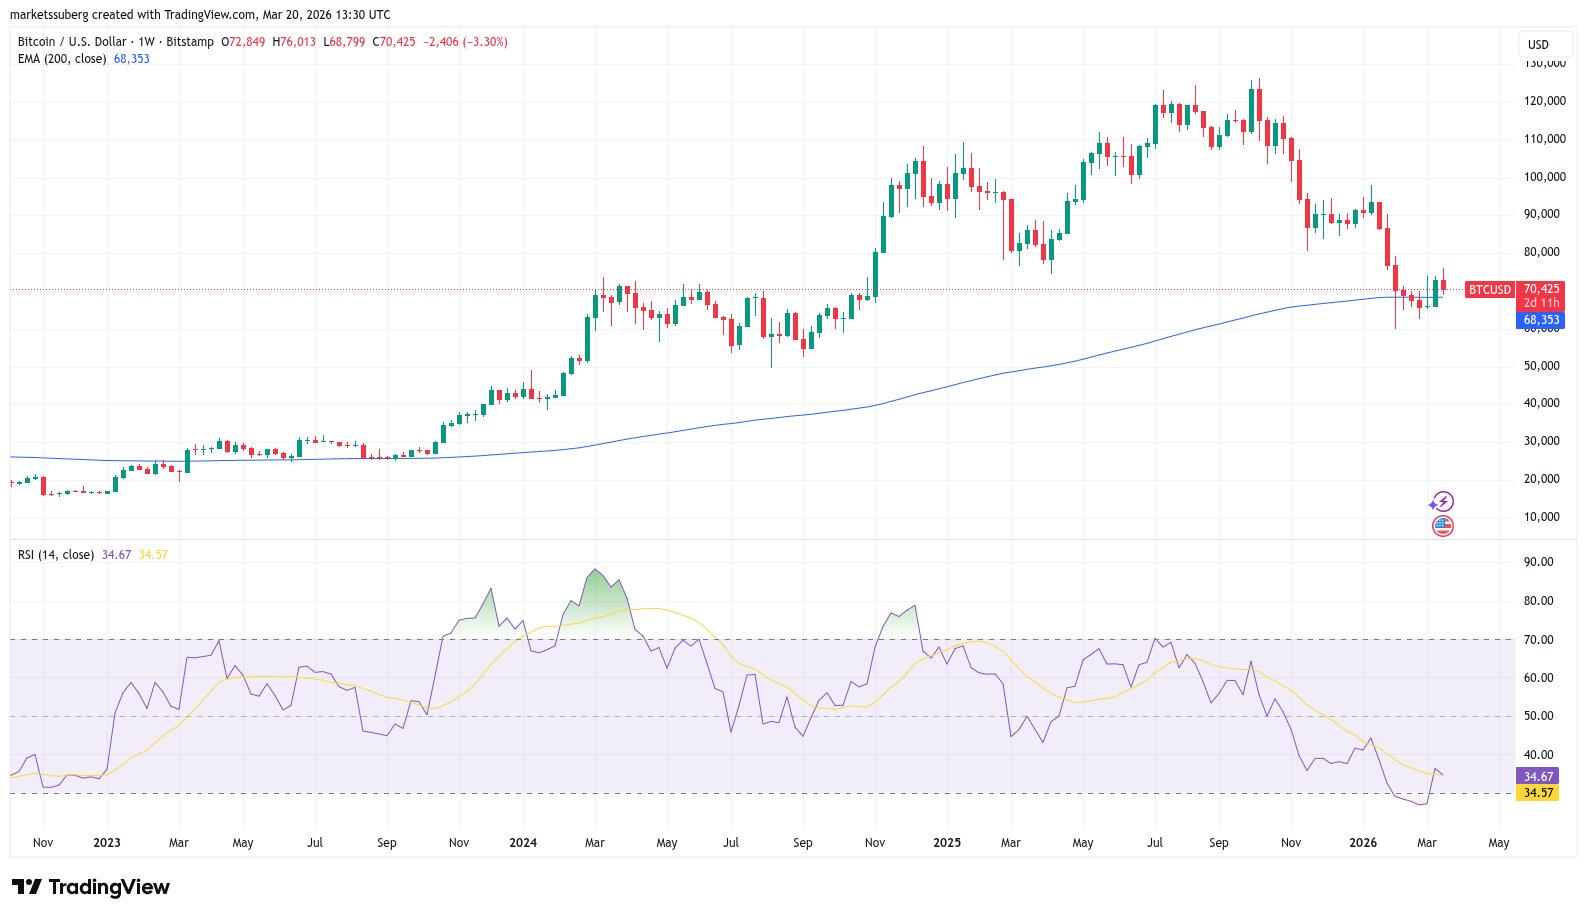
Bitcoin RSI is approaching a critical long-term position for the fate of the bear market.
-
RSI needs a weekly bullish divergence to repeat its early-2023 rebound.
-
A trader says he is “not in a rush” to reenter the market with the comedown from all-time highs just a few months old.
Bitcoin RSI: All eyes on higher low
New analysis covering relative strength index (RSI) data on BTC/USD concludes it could soon be “time to pay attention.”
Bitcoin bear-market bottoms often follow the start of a bullish divergence with RSI on weekly time frames.
For trader Jelle, current market behavior is following historical trends, and Bitcoin’s next inflection point may be around the corner.
“When $BTC’s weekly RSI makes a higher low again, it’s time to pay attention,” he wrote on X.
A classic bullish divergence locks in when RSI makes a higher low while price makes lower lows. Jelle, however, says that price has room to maneuver and still preserve the emerging recovery.
“Doesn’t matter if BTC makes a higher low, equal low, or lower low,” he continued.
“When RSI starts moving higher again, the bottom is very close – or already in.”
BTC price bear flag still in play
RSI last flipped bullish at the end of Bitcoin’s 2022 bear market, and its signals preceded a period of upside that continued for over a year.
Related: Bitcoin tests old 2021 top as gold falls to six-week lows under $4.7K
At the time, talk also focused on reclaiming the 200-week exponential moving average (EMA) as support, something that occurred in March 2023.
As Cointelegraph reported, the 200-week EMA was only lost again last month, with analysis calling the trend line “unreliable.”
Jelle, meanwhile, is among those speculating that previous cycles demand a much longer bear market than the few months that have elapsed so far.
“Previous bear markets all lasted around a year. $BTC topped just 23 weeks ago, and looks like this,” he told X followers.
“I’m not in a rush to buy back in.”
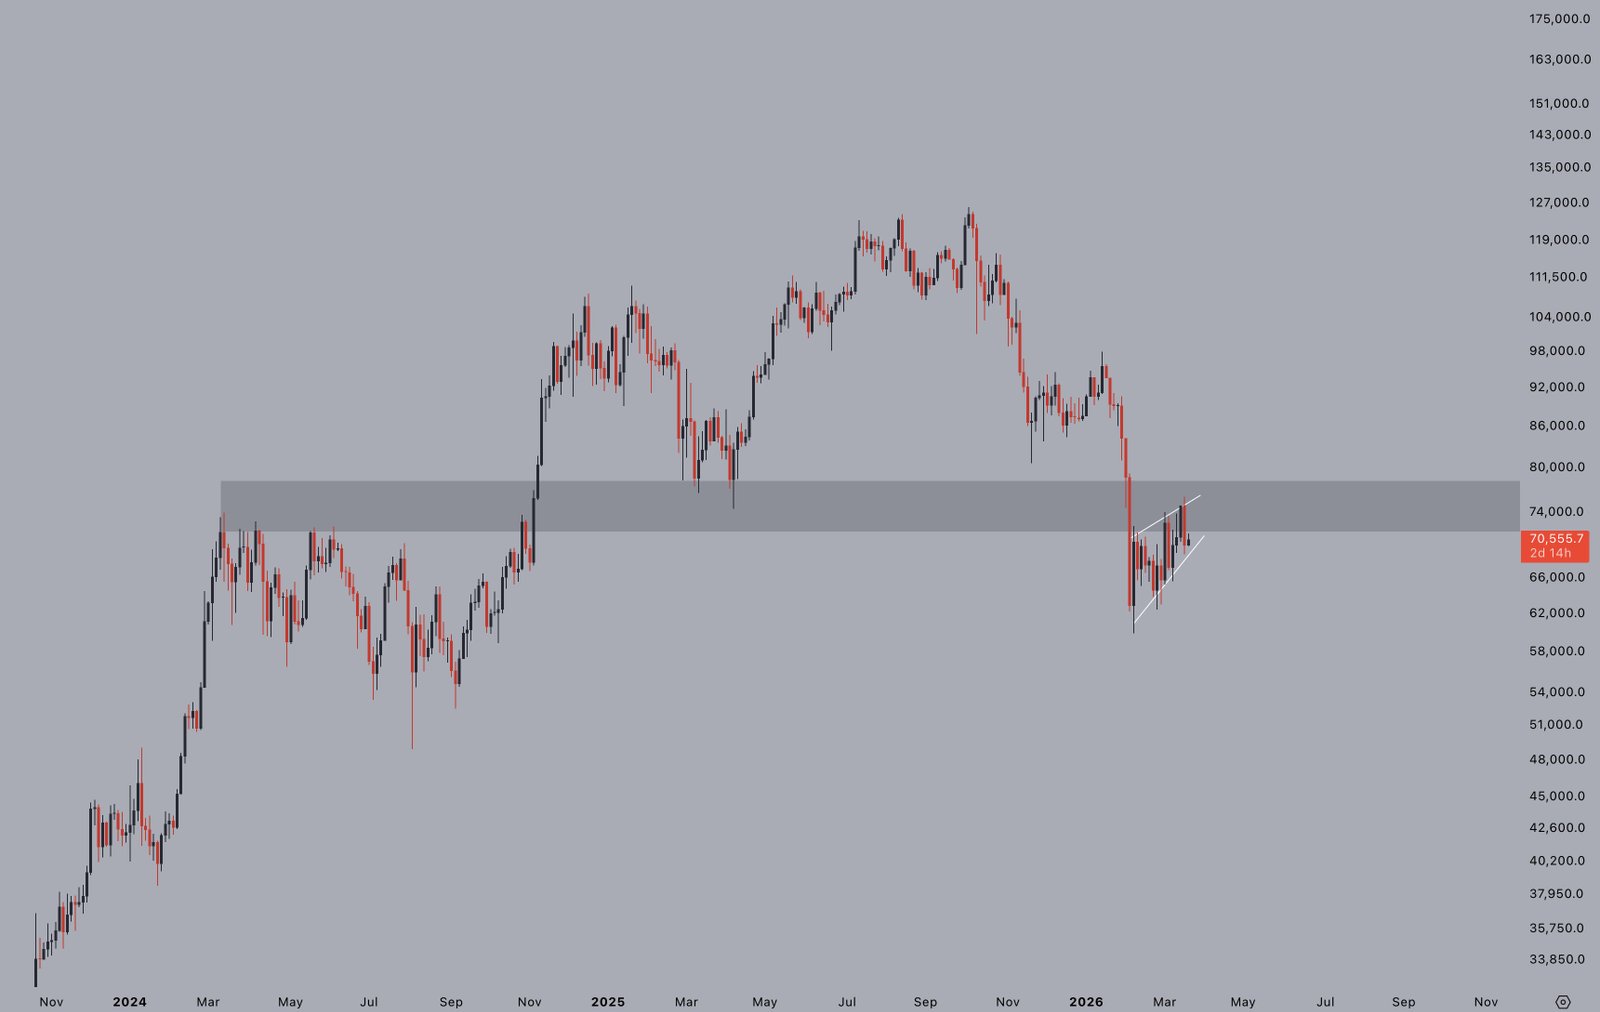
A separate chart drew attention to a possible bear flag formation under development — a sign of weakness that could result in a fresh support failure in a manner similar to January.
Dieser Artikel enthält keine Anlageberatung oder -empfehlungen. Jede Anlage- und Handelsmaßnahme birgt Risiken, und Leser sollten bei ihrer Entscheidung eigene Recherchen durchführen. Obwohl wir bestrebt sind, genaue und aktuelle Informationen bereitzustellen, übernimmt Cointelegraph keine Garantie für die Richtigkeit, Vollständigkeit oder Zuverlässigkeit der Informationen in diesem Artikel. Dieser Artikel kann zukunftsgerichtete Aussagen enthalten, die Risiken und Unsicherheiten unterliegen. Cointelegraph haftet nicht für Verluste oder Schäden, die sich aus Ihrem Vertrauen auf diese Informationen ergeben.