
Die technischen und fundamentalen Katalysatoren von Zcash erhöhen die Wahrscheinlichkeit, dass der ZEC-Preis in den kommenden Wochen auf bis zu 200 US-Dollar sinken wird, nachdem die Kernentwickler das Projekt verlassen haben.
Zcash (ZEC) slid more than 20% on Thursday to around $381, marking its weakest price level in three weeks, as markets reacted to the sudden resignation of the core development team from the Electric Coin Company (ECC).
Key takeaways:
Former CEO Josh Swihart confirmed that the team will form a new company to continue privacy-focused development. But his assurance failed to lift the market’s mood, prompting many analysts to predict further declines in Zcash prices ahead.
But how low can the ZEC price go?
Zcash descending channel raises 40-50% crash odds
ZEC’s price can drop another 40-50% in the coming weeks, according to a technical setup shared by analyst Osemka.
The price started correcting after testing the upper trendline of its prevailing descending channel pattern, resembling a pullback from November that resulted in a 58% correction a month later.
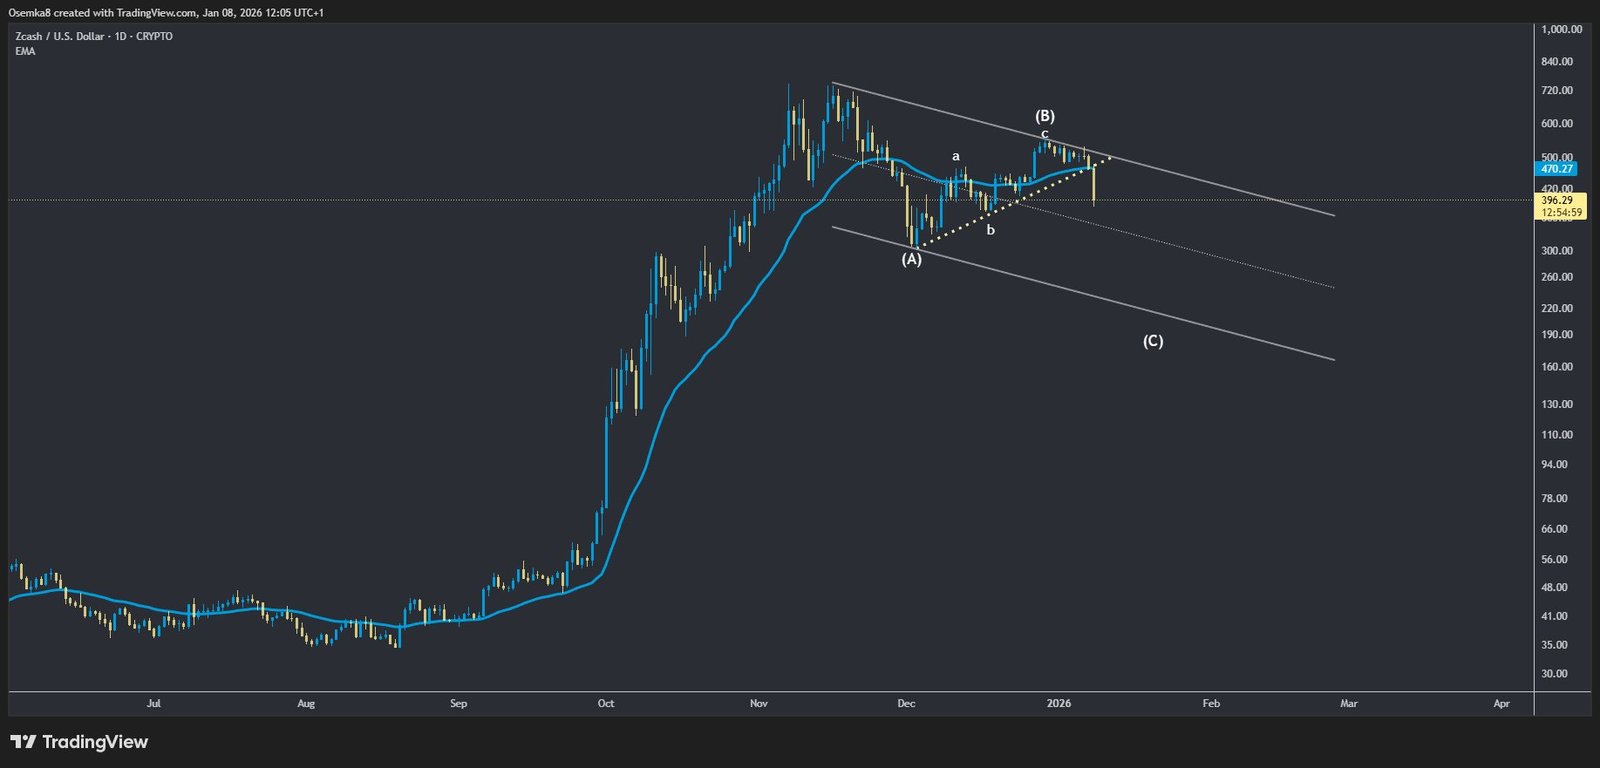
Simultaneously, ZEC’s price broke below a support confluence comprising a rising trendline and a 20-day exponential moving average (20-day EMA; the blue wave in the chart above).
While the rising trendline had supported its 85% recovery move in the past month, the 20-day EMA capped Zcash’s downside attempts during the 1,000%-plus rally in late 2025.
Related: Zcash backer Bootstrap says split due to clash over nonprofit rules, Zashi future
Breaking below this confluence raised ZEC’s odds of falling toward the ascending channel’s lower trendline, roughly around the $200-250 area, in the coming weeks.
Zcash bear flag target: $275–$300
As of Thursday, Zcash was breaking out of its prevailing bear flag pattern, reinforcing the downside bias.
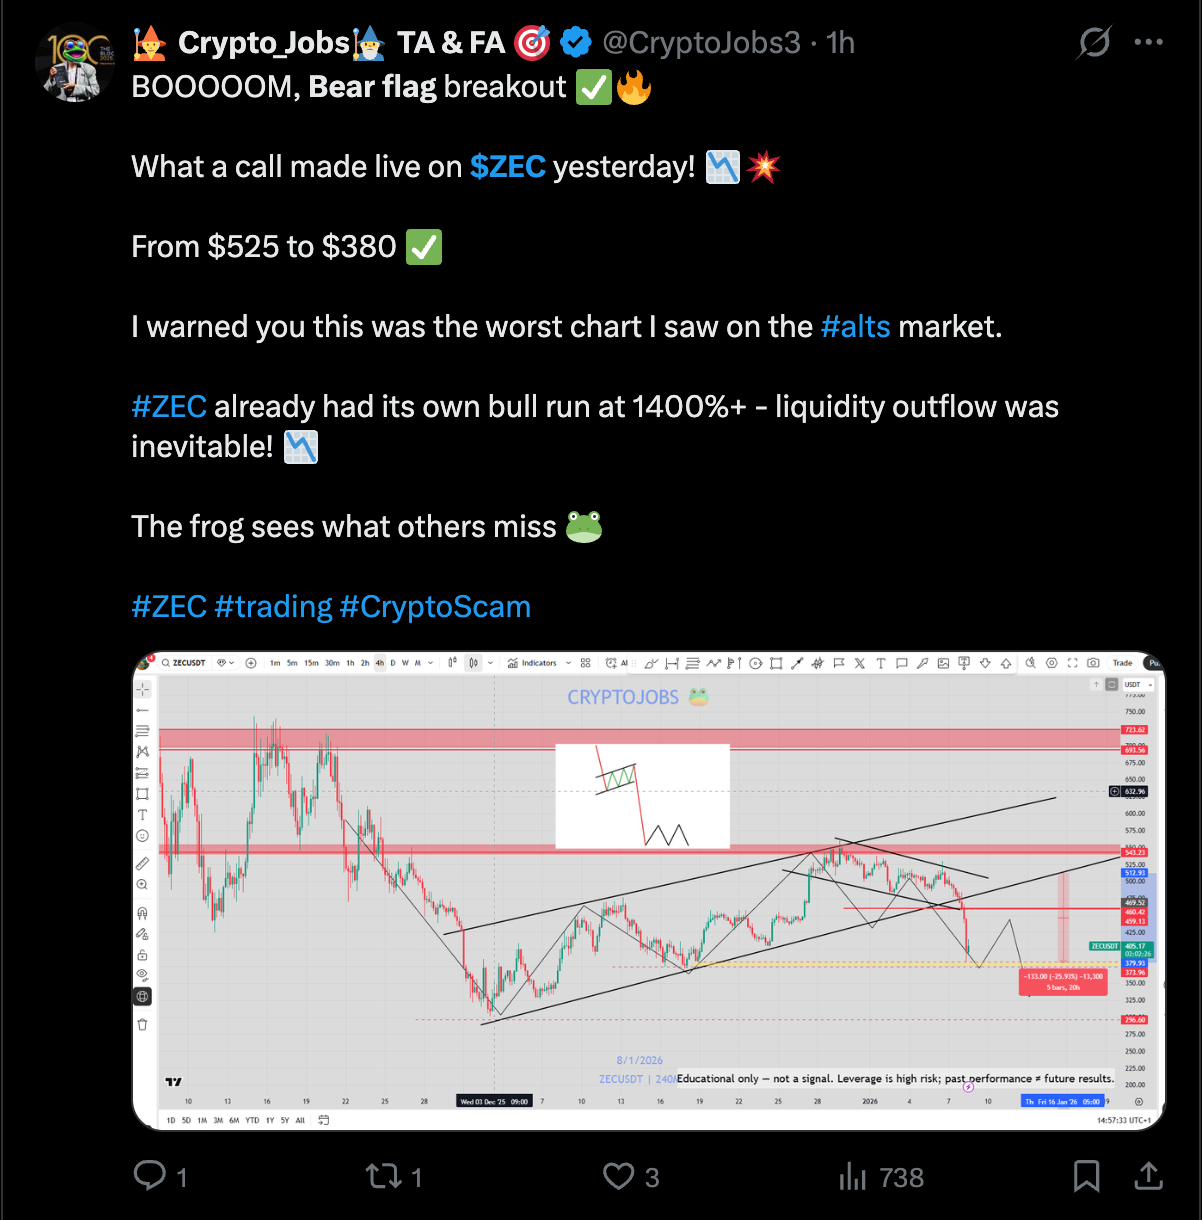
After its sharp sell-off from the $550–$580 region, ZEC entered a brief upward-sloping consolidation, capped by descending resistance, a typical bear flag pattern that often resolves lower.
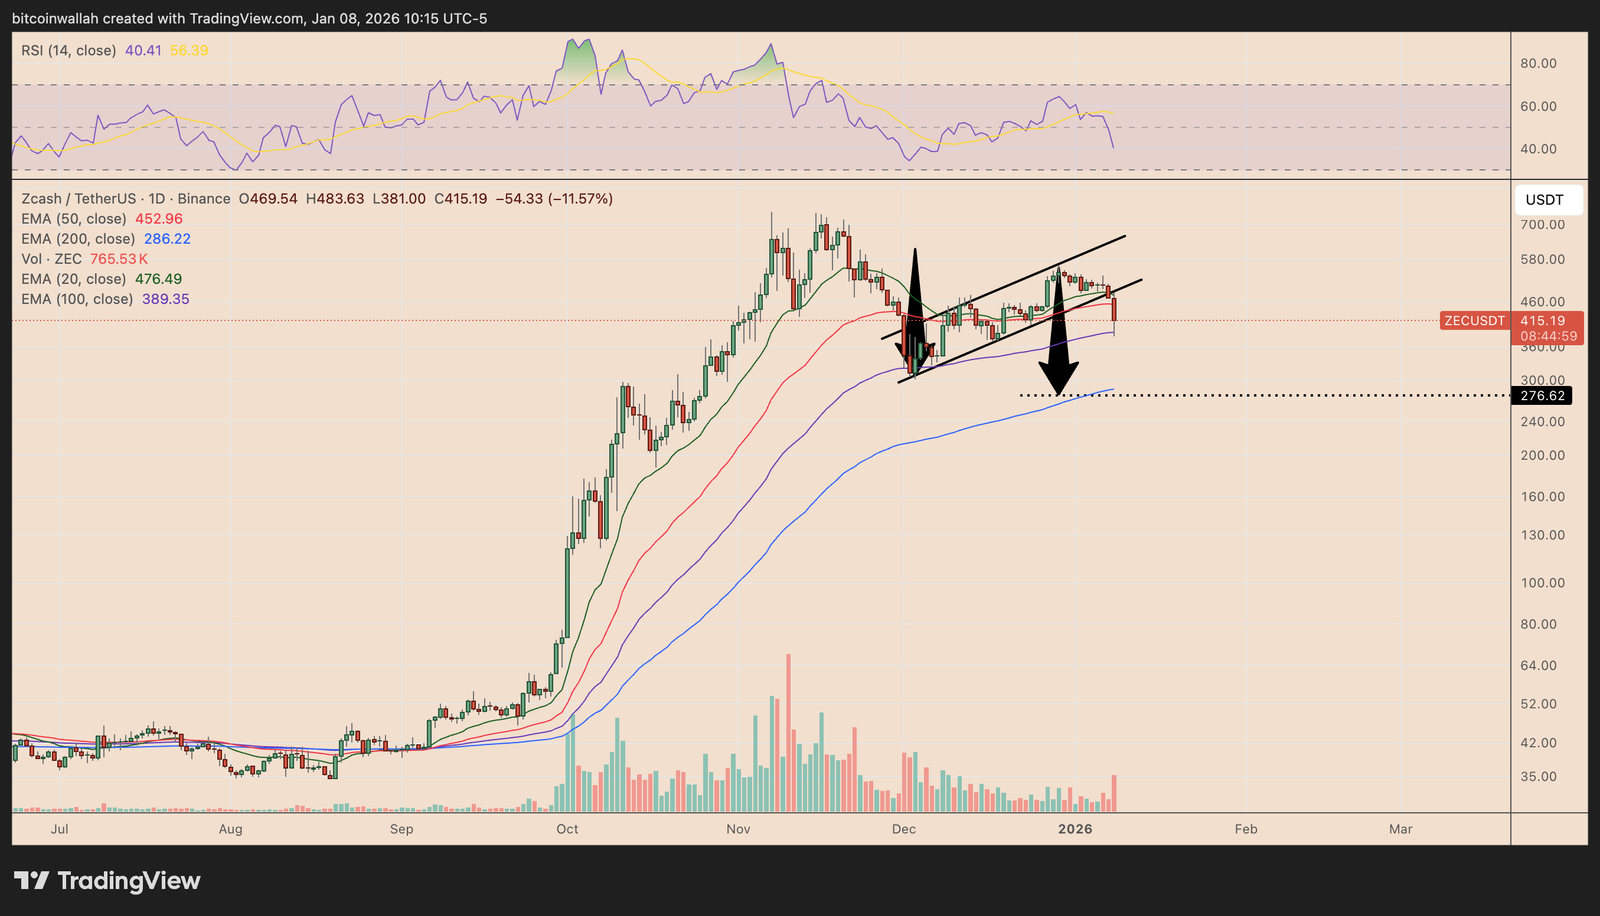
The measured move pointed toward the $275–$300 zone if the pattern plays out fully. This target area aligned closely with the 200-day EMA (the blue wave), making it a likely downside magnet in the weeks ahead.
Dieser Artikel enthält keine Anlageberatung oder -empfehlungen. Jede Anlage- und Handelsmaßnahme birgt Risiken, und Leser sollten bei ihrer Entscheidung eigene Recherchen durchführen. Obwohl wir bestrebt sind, genaue und aktuelle Informationen bereitzustellen, übernimmt Cointelegraph keine Garantie für die Richtigkeit, Vollständigkeit oder Zuverlässigkeit der Informationen in diesem Artikel. Dieser Artikel kann zukunftsgerichtete Aussagen enthalten, die Risiken und Unsicherheiten unterliegen. Cointelegraph haftet nicht für Verluste oder Schäden, die sich aus Ihrem Vertrauen auf diese Informationen ergeben.