
Tuesday’s session extended the AI-fueled equity rally to a ninth consecutive advance, with the S&P 500 crossing 7,600 for the first time as semiconductor names surged on Nvidia CEO Jensen Huang’s bullish outlook on Marvell Technology.
Crude oil reversed earlier session losses to settle modestly higher, sustained by a geopolitical risk premium that remained firmly intact as the U.S.-Iran Strait of Hormuz standoff entered another day without a confirmed deal. Bitcoin diverged sharply from the broadly constructive tone in equities, shedding more than 5% in a persistent and unidirectional decline with no clear identifiable catalysts earlier today.
Check out the forex news and economic updates you may have missed in the latest trading session!
Forex News Headlines & Data:
- Australia Building Permits Prel for April 2026: 10.2% y/y (12.9% y/y forecast; 9.0% y/y previous)
- Australia Business Inventories for Q1 2026: 0.5% q/q (-0.2% q/q forecast; -0.1% q/q previous)
- Australia Company Gross Profits for Q1 2026: -1.3% q/q (-0.1% q/q forecast; 5.8% q/q previous)
- Swiss Balance of Trade for April 2026: 3.2B (2.3B forecast; 2.7B previous)
-
U.K. Monetary Developments for April 2026:
- U.K. Mortgage Approvals for April 2026: 65.94k (62.0k forecast; 63.53k previous)
- U.K. BoE Consumer Credit for April 2026: 1.86B (1.8B forecast; 1.9B previous)
- U.K. M4 Money Supply for April 2026: 0.2% m/m (0.9% m/m forecast; 0.8% m/m previous)
-
Euro area CPI Growth Rate Flash for May 2026: 3.2% y/y (3.4% y/y forecast; 3.0% y/y previous)
- Euro area Core Inflation Rate Flash for May 2026: 2.5% y/y (2.4% y/y forecast; 2.2% y/y previous)
-
JOLTs U.S. Job Openings for April 2026: 7.62M (6.8M forecast; 6.87M previous)
- JOLTs Job Quits for April 2026: 2.98M (3.1M forecast; 3.17M previous)
- New Zealand Global Dairy Trade Price Index for June 2, 2026: -0.6% (0.6% previous)
Promotion: TradeZella is the top journaling app in the industry, and its new AI trading partner feature can break down and analyze your trades & build a game plan, freeing up time and energy to focus on the next moves!
Start Your Trading Journey with Tradezella & use code “PIPS20” for 20% off your first purchase!
Disclosure: To help support our free daily content, we may earn a commission from our partners if you sign up through our links, at no extra cost to you.
Broad Market Price Action:
Dollar Index, Gold, Oil, S&P 500, U.S. 10-yr Yield, Bitcoin Overlay – Chart Faster With TradingView
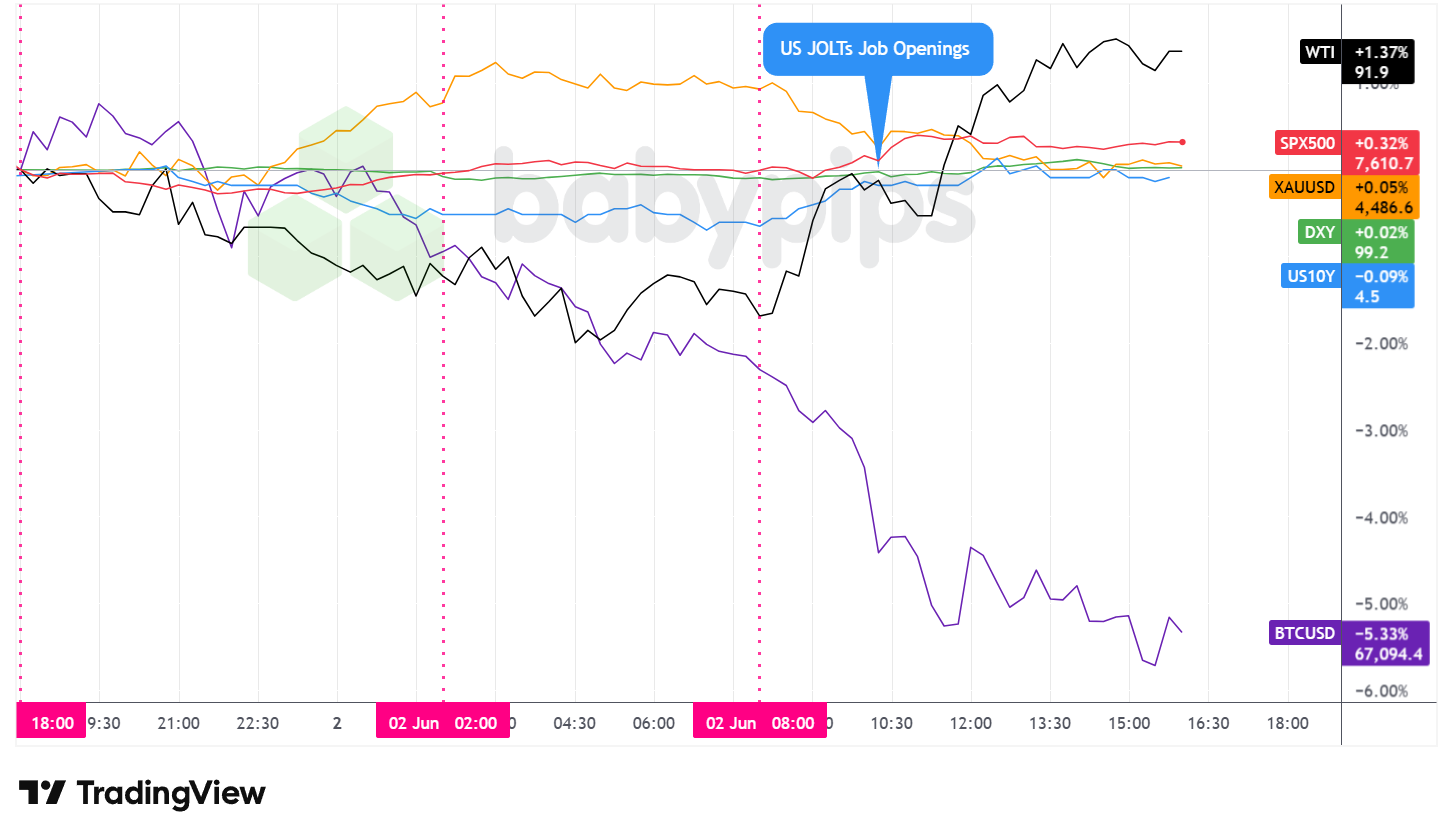
Tuesday’s broad market session produced a notably divergent performance across asset classes, with equities and crude oil posting gains while Bitcoin extended its recent slide and gold finished essentially unchanged after tracing a wide intraday arc.
The S&P 500 posted its ninth consecutive advance, closing around 7,611 and breaking above 7,600 for the first time. The session’s momentum was concentrated in the semiconductor space, where Marvell Technology surged after Nvidia CEO Jensen Huang predicted the company could reach a trillion-dollar valuation, and Hewlett Packard Enterprise jumped following strong quarterly results and an upwardly revised full-year outlook.
Alphabet weighed on the index, falling nearly 4% after announcing its $80 billion equity offering, though the dilution concern was not enough to break the winning streak. The April JOLTs Job Openings report delivered a major beat, with openings rising to 7.62 million against a 6.80 million forecast, their highest level in nearly two years, which may have reinforced broader confidence in the durability of U.S. economic activity.
WTI crude oil reversed an earlier session decline to settle roughly 1.4% higher near $91.90 per barrel. Prices had slipped from the previous evening through the early London hours before recovering as the U.S. session got underway. The intraday recovery likely reflected a reduction in near-term tail risk after Trump stated that U.S.-Iran talks are continuing, containing concerns about a full diplomatic breakdown. However, residual skepticism about an imminent Hormuz reopening deal appeared to keep the underlying supply risk premium in place, and the session close suggests markets are not yet pricing in a resolution as a base case. The ongoing impact of the conflict on supply chains and manufacturing costs was also underscored by Monday’s ISM Manufacturing PMI for May, where 42% of survey panelists cited the Iran war as a direct concern.
Gold ended the session essentially unchanged, closing near $4,487 per ounce. The metal followed a wide intraday arc, rallying during the Asian and early London sessions before reversing as the U.S. session got underway and giving back most of its earlier advance by the close. The rise may have reflected continued geopolitical uncertainty and safe-haven demand, while the pullback broadly coincided with the stronger-than-expected JOLTs data, which may have reduced the perceived urgency of defensive positioning. No specific gold-related catalyst was identifiable to explain the magnitude of either leg of the move.
Bitcoin was the session’s clear laggard, falling more than 5% to trade near $67,094. The decline was steady and broadly unidirectional across all sessions with no apparent fundamental catalyst. The move stood in notable contrast to the constructive tone in equities and warrants monitoring for follow-through.
U.S. 10-year Treasury yields edged modestly lower, settling near 4.50%. The subdued decline despite the day’s significant JOLTs beat possibly suggests the bond market is looking through near-term labor market resilience toward expectations that energy-driven inflation may ease in the second half of the year, which could allow the Fed to remain on hold rather than tighten further.
Have a solid trading strategy but lack the capital? FundedNext empowers disciplined traders by providing simulated trading accounts up to $200K.
Unlike other prop firms, FundedNext imposes no artificial time limits on challenges. You even earn a unique 15% profit share during your evaluation! Once funded, you keep up to a 95% profit split with guaranteed 24-hour payouts. Trade CFDs or Futures your way—even during major news events.
Join over 400K traders who have received $300M+ in payouts. Ready to back your edge?
Learn More About FundedNext! Limited time offer: Use code BPFN for 47% off first 5 Futures FLEX challenges, 40% off of the 6th & beyond. T&C apply.Disclosure: We may earn a commission from our partners if you sign up through our links, at no extra cost to you.
FX Market Behavior: U.S. Dollar vs. Majors
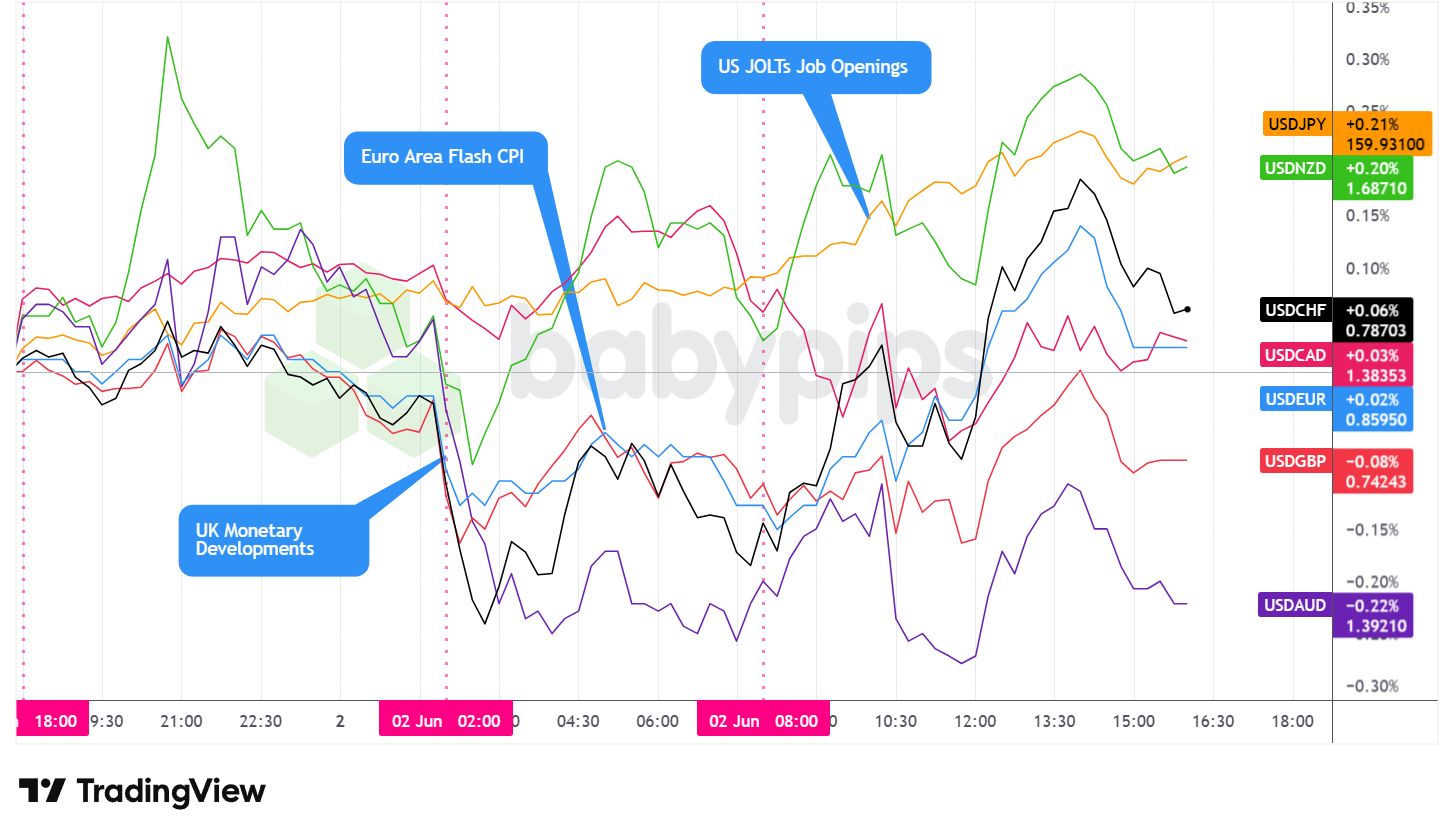
Overlay of USD vs. Majors – Chart Faster With TradingView
The U.S. dollar closed Tuesday with a mixed but arguably neutral to slightly net bullish posture against the major currencies, with the overall DXY registering a negligible gain of roughly 0.02%. The session was characterized by several intraday directional shifts rather than a sustained trend in either direction.
During the Asian session, the dollar traded choppy and sideways in mixed fashion, initially leaning net bullish before gradually turning net bearish heading into the London open. The absence of significant Asia-Pacific catalysts kept moves contained. Finance Minister Katayama’s confirmation of close U.S.-Japan foreign exchange coordination provided a modest anchor for dollar-yen, with the pair trading quietly near 159.70. A package of Australian Q1 data released during the session, including a wider-than-expected current account deficit and a net trade drag that significantly exceeded forecasts, reinforced expectations for a soft Q1 GDP print due Wednesday. Hawkish commentary from RBA board member Ian Harper, who flagged persistent inflation and a returning output gap as reasons to keep an August rate hike on the table, provided a partial offset for the Australian dollar.
During the London session, the dollar fell against the major currencies on net following the European open but quickly found a floor and traded choppy through the remainder of the session heading into the U.S. open. The session’s main data event was the Eurozone Flash CPI for May, where headline inflation came in at 3.2% year-over-year, below the 3.4% forecast but above the prior 3.0%, while core inflation edged up to 2.5% from 2.2%, slightly above the 2.4% consensus. The mixed print reinforced expectations for a June ECB rate increase, framed by Governing Council member Rehn as a one-off insurance measure rather than the start of a sequential tightening cycle.
U.K. mortgage approvals for April came in above expectations at 65.94k versus the 62.0k forecast, continuing to hold above their six-month average and contributing to a resilient backdrop for sterling.
During the U.S. session, the dollar traded mixed against the major currencies but saw net bullish behavior emerge in the afternoon. The April JOLTs Job Openings report came in far above expectations at 7.62 million versus a 6.80 million forecast, their highest level in nearly two years, and likely contributed to afternoon dollar support.
Promoted: The Strategy is Half the Battle; Your Mindset is the Rest.
In “Unknown Market Wizards,” (⭐ 4.6★ | 1,400+ reviews on Amazon) Jack Schwager interviews successful traders to reveal a common truth: their edge isn’t just knowledge or skills—it’s their psychological resilience and rigid risk control. Whether you’re navigating shifting geopolitical themes or top tier economic data, learn how the “wizards” stay clinical when the rest of the market is emotional.
Master Your Trading Mindset with Market Wizards!
Disclosure: We may earn a commission from our partners if you sign up through our links, at no extra cost to you.
Upcoming Potential Catalysts on the Economic Calendar
- New Zealand Building Permits for April 2026 at 10:45 pm GMT
- New Zealand Import & Export Prices for March 31, 2026 at 10:45 pm GMT
- Australia S&P Global Services PMI Final for May 2026 at 11:00 pm GMT
- Australia AIG Manufacturing Index for May 2026 at 11:00 pm GMT
- Japan S&P Global Services PMI Final for May 2026 at 12:30 am GMT
- Australia GDP Growth Rate for March 31, 2026 at 1:30 am GMT
- China RatingDog Services PMI for May 2026 at 1:45 am GMT
- Euro area S&P Global Services PMI Final for May 2026 at 8:00 am GMT
- U.K. S&P Global Services PMI Final for May 2026 at 8:30 am GMT
- Bank of Japan Governor Ueda Speech at 8:30 am GMT
- Euro area PPI for April 2026 at 9:00 am GMT
- U.S. MBA 30-Year Mortgage Rate for May 29, 2026 at 11:00 am GMT
- U.S. MBA Mortgage Applications for May 29, 2026 at 11:00 am GMT
- ADP National Employment Report for May 2026 at 12:15 pm GMT
- Canada Labor Productivity for March 31, 2026 at 12:30 pm GMT
- U.S. Fed Barr Speech at 1:00 pm GMT
- Canada S&P Global Services PMI for May 2026 at 1:30 pm GMT
- ISM Services PMI for May 2026 at 2:00 pm GMT
- U.S. Factory Orders for April 2026 at 2:00 pm GMT
- EIA Crude Oil Stocks Change for May 29, 2026 at 2:30 pm GMT
- U.S. Fed Goolsbee Speech at 3:00 pm GMT
- U.S. Fed Beige Book at 6:00 pm GMT
- U.S. Fed Logan Speech at 8:00 pm GMT
Wednesday’s session opens in the Asia-Pacific with Australia’s Q1 GDP print at 1:30 am GMT, where today’s softer current account and net trade data have set up expectations for a weak outturn.
The U.S. ADP National Employment report at 12:15 pm GMT and the ISM Services PMI at 2:00 pm GMT are the headline North American releases, with the ADP serving as a key preview of Friday’s nonfarm payrolls.
BOJ Governor Kazuo Ueda speaks at 8:30 am GMT amid ongoing debate about Japan’s bond market trajectory, with the government’s reported food sales tax cut proposal adding a fresh fiscal dimension to any yield-sensitive commentary.
The EIA crude oil inventory data at 2:30 pm GMT will be closely watched given the elevated geopolitical premium in oil markets, and the Fed Beige Book at 6:00 pm GMT may offer fresh color on how U.S. businesses are navigating rising energy costs.
Stay frosty out there, forex friends!
The JOLTs report beat expectations, but understanding why that beat moved currencies differently than a typical “good news” scenario requires learning how the forex market actually interprets economic data. Premium members can read our lesson:
📖 Market Expectations: Why Good News Can Tank a Currency
Reading this helps you understand why deviations from expectations matter more than headline numbers, how to interpret market reactions instead of just being confused by them, and why the same data beat can support one currency while pressuring another.
And if you’re not a Premium subscriber yet, now’s a good time to sign up.
With Babypips Premium, you get full access to School of Pipsology lessons that help you understand not just what economic data says, but how market expectations transform that data into currency moves