")
Australia’s labor market swung back hard in May, printing a strong rebound over the dismal decline back in April and bringing the jobless rate down a notch to 4.4%.
On the surface, this was a clear beat. Underlying figures, however, painted a different picture as part-time hiring accounted for the majority of the gains while hours worked fell. The Australian Bureau of Statistics also flagged ongoing methodology changes as it transitions its Labor Force Survey collection system, which may have introduced some noise into the monthly figures.
Even so, these weren’t enough to stop markets from reading the results as broadly supportive of the RBA’s tightening path. Let’s see which setups from our watchlist were in the position to capitalize given the risk backdrop, and what actually happened when the numbers hit.
Watchlists are price outlook & strategy discussions supported by both fundamental & technical analysis, a crucial step towards creating a high-quality discretionary trade idea before working on a risk & trade management plan.
If you’d like to follow our “Watchlist” picks right when they are published throughout the week, check out our BabyPips Premium subscribe page to learn more!
The Setup
What We Were Watching: Australia’s Employment Report (May 2026)
- Expectation: Consensus called for 26,000 net new jobs, with unemployment expected to pull back from 4.5% to 4.4%.
- Outcome: Employment rose 40,300, and unemployment fell to 4.4% as expected, though the quality of the gain leaned part-time. Hours worked declined and underemployment edged higher
- Market environment surrounding the event: After seemingly moving on from geopolitical headlines, markets turned their attention to AI-related tech valuation concerns that triggered equity declines during the first half of the week. Strengthening Fed rate hike expectations as markets braced for a firm U.S. core PCE print also contributed to risk-off flows, though Micron’s upbeat guidance lifted chipmaker stocks during the back half of the week, along with a “buy the rumor, sell the news” reaction to the Fed’s preferred inflation print.
Event Outcome
The May employment report printed 40,300 net new jobs, well above the 26,000 consensus, while the unemployment rate fell to 4.4% from 4.5% the prior month. That fully reversed April’s ugly 40,700-job loss, which had sent the jobless rate to its highest since late 2021.
However, full-time hiring only contributed 5,200 of those gains, with part-time jobs doing the heavy lifting at 35,200. Hours worked actually fell 1.1%, showing a notable divergence from the employment count, and underemployment ticked up slightly to 5.9%.
Key Takeaways:
- Employment change: +40,300 (26,000 expected; -18,600 prior)
- Unemployment rate: 4.4% (4.4% expected; 4.5% prior) — down 0.1 percentage points
- Unemployed persons: Fell by 18,300 to 671,300
- Full-time employment: +5,200 — the minority of the gain
- Part-time employment: +35,200 — the overwhelming driver of the headline
- Hours worked: -1.1% to 2,010 million monthly hours — a red flag divergence
- Underemployment: Rose 0.1 percentage points to 5.9%
- Participation rate: Ticked up marginally to 66.7%
- Employment-to-population ratio: +0.1 percentage points to 63.8%
- Youth unemployment: Improved, falling 0.6 percentage points to 10.4%
- State divergence: Victoria and Queensland each posted ~0.6% employment gains; Western Australia shed 0.9%
Fundamental Bias Triggered: Bullish AUD
Promotion: Top-tier catalysts like the Australian employment release can trigger emotional execution.
TradeZella’s AI powered journal turns your raw data into a high-performance playbook. Sync your broker, replay your trades bar-by-bar, and use the Playbook Designer to ensure that next time an economic data point surprises the market, you’re executing with clinical precision.
Click on the link to learn more and use code “PIPS20” to save 20% off first purchase!
Disclosure: We may earn a commission from our partners if you sign up through our links, at no extra cost to you.
Broad Market and Exogenous Drivers:
AI Valuation Stress and Geopolitical Relief (Monday to Tuesday)
The week opened with markets caught between geopolitical relief and AI valuation anxiety. US-Iran talks in Switzerland produced a 60-day roadmap toward a deal, Iran resumed crude loadings at Kharg Island, and WTI crude fell about 4.4% to $74.10 as the war premium faded. But equities struggled after SpaceX shares dropped roughly 13% on a large AI infrastructure bond issuance, dragging megacap tech lower and keeping the S&P 500 near flat. UK Prime Minister Starmer’s resignation and transition plan to Andy Burnham lifted Sterling, while Canada’s hotter May CPI at 3.2% year on year helped keep the dollar near session highs.
Tuesday brought cleaner risk off trading. South Korean equities triggered circuit breakers on AI valuation concerns, boosting demand for JPY and CHF in Asia. Weak European and UK flash PMIs reinforced the US growth advantage, while stronger US PMIs, with manufacturing at 55.7 and services at 51.3, pushed the dollar index toward its strongest level since November near 101.4.
Dollar at 101.6 and Micron’s After Hours Beat (Wednesday)
Australia’s May CPI added to the policy fog, as headline inflation slowed to 4.0% year on year and missed forecasts, while the RBA’s trimmed mean core measure accelerated to 3.6%. RBA Deputy Governor Hauser said inflation remained “far too high,” limiting the dovish takeaway. The SNB’s quarterly bulletin also flagged willingness to intervene in FX markets, reinforcing pressure on the franc.
WTI crude fell another 3.8% to below $70 as the war premium continued to unwind, while the dollar index edged up to 101.6. Micron fell 2.5% ahead of results, then delivered a blowout quarter after the close, with revenue of $41.46 billion, gross margin at 84.9%, and next quarter guidance of $50 billion.
Micron Spillover, Hormuz Friction, and PCE (Thursday to Friday)
Micron’s results lifted chipmakers on Thursday, helping offset caution around Australia’s part-time heavy jobs beat and renewed Strait of Hormuz friction. US core PCE rose 0.3% m/m and 3.4% y/y, yet the dollar sold off as traders took profits after its strong first-half rally.
Friday ended sharply risk off after a New York Times report suggested OpenAI was leaning toward delaying its IPO. Asian equities tumbled, with the Nikkei down more than 4.5%, the KOSPI triggering circuit breakers near an 8% loss, and Hong Kong and Shanghai each falling more than 2%. A wider US advance goods trade deficit of $105.8 billion versus an $84.0 billion consensus added pressure on the dollar into month-end.
AUD/CHF: Net Bullish AUD Event Outcome + Mixed Risk Environment
AUD/CHF 1-Hour Forex Chart Faster with TradingView
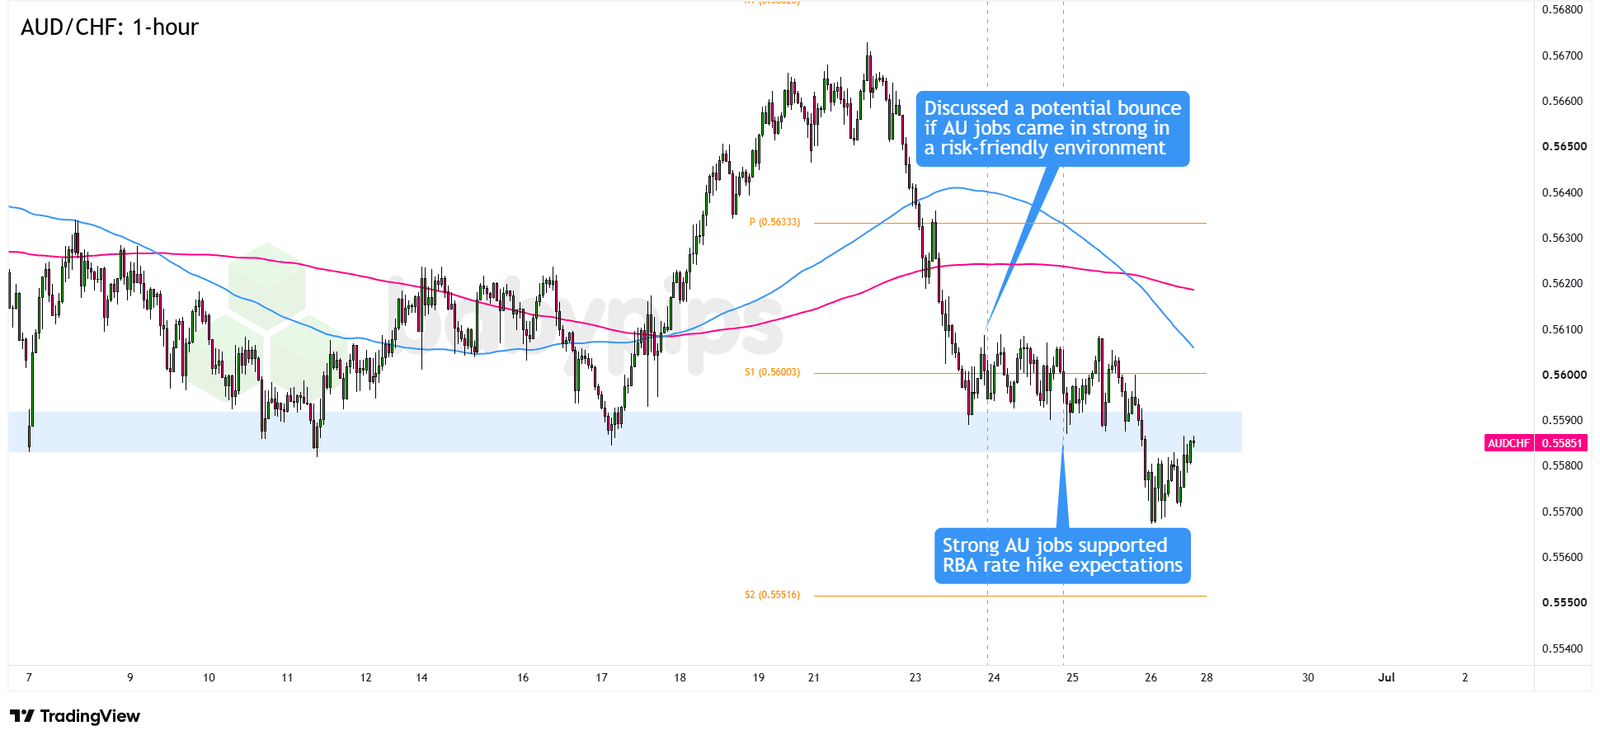
Micron’s blowout earnings created a cautiously risk-on lean at the Asian open on June 25, and Australia’s jobs report then beat the headline forecast at 40,300 positions added with unemployment back at 4.4%. Both conditions required for the AUD/CHF bullish setup (a strong jobs print and a risk-positive environment) were present at the time of the release. On that basis, this watchlist discussion on AUD/CHF was arguably the best positioned to move beyond the watchlist stage.
But the pair didn’t deliver the anticipated bounce from S1 (0.5600). AUD’s response to the actual report was bearish from the first candle: a sharp spike lower hit AUD pairs in the hour following the release as markets absorbed the part-time-heavy composition, the deeper April revision, and the 1.1% decline in hours worked. Those details capped any hawkish RBA repricing the headline might otherwise have prompted.
CHF compounded the problem. The IRGC’s rejection of the Omani-IMO Hormuz transit framework during the mid-Asian session pulled safe-haven flows into the franc alongside the jobs window, pushing AUD/CHF through S1 rather than triggering the anticipated bounce. By the European open, AUD/CHF was softer on the day, and it closed Thursday as a net loser on the cross. Friday’s Asia-driven risk-off session, triggered by the OpenAI IPO delay report, pressed the pair below S1 and toward the 0.5585 area.
Traders who positioned for the AUD/CHF bounce on the basis of the headline faced two simultaneous headwinds: AUD selling on the composition details and CHF buying on a separate geopolitical catalyst. The conditions were aligned on paper when the data landed. The execution window closed before either dynamic had time to reverse.
Promoted: Capitalize on the News Events Without Risking Your Own Funds.
In a major jobs report release, the corresponding currency can swing wildly intraday. Why risk your personal capital during extreme volatility?
Most proprietary firms terminate your evaluation account if you execute a trade during a major macroeconomic release, but FundedNext permits news trading across all models. Test your thesis with up to $300,000 in simulated capital, or take advantage of their Free Trial to experience the platform risk-free.
Explore FundedNext and Start Your Free Trial!
Disclosure: We may earn a commission from our partners if you sign up through our links.
Not Eligible to Move Beyond Watchlist – AUD/NZD & Bearish AUD Setups
AUD/NZD: Bullish AUD Event Outcome + Risk-Off Scenario
AUD/NZD 1-Hour Forex Chart Faster with TradingView
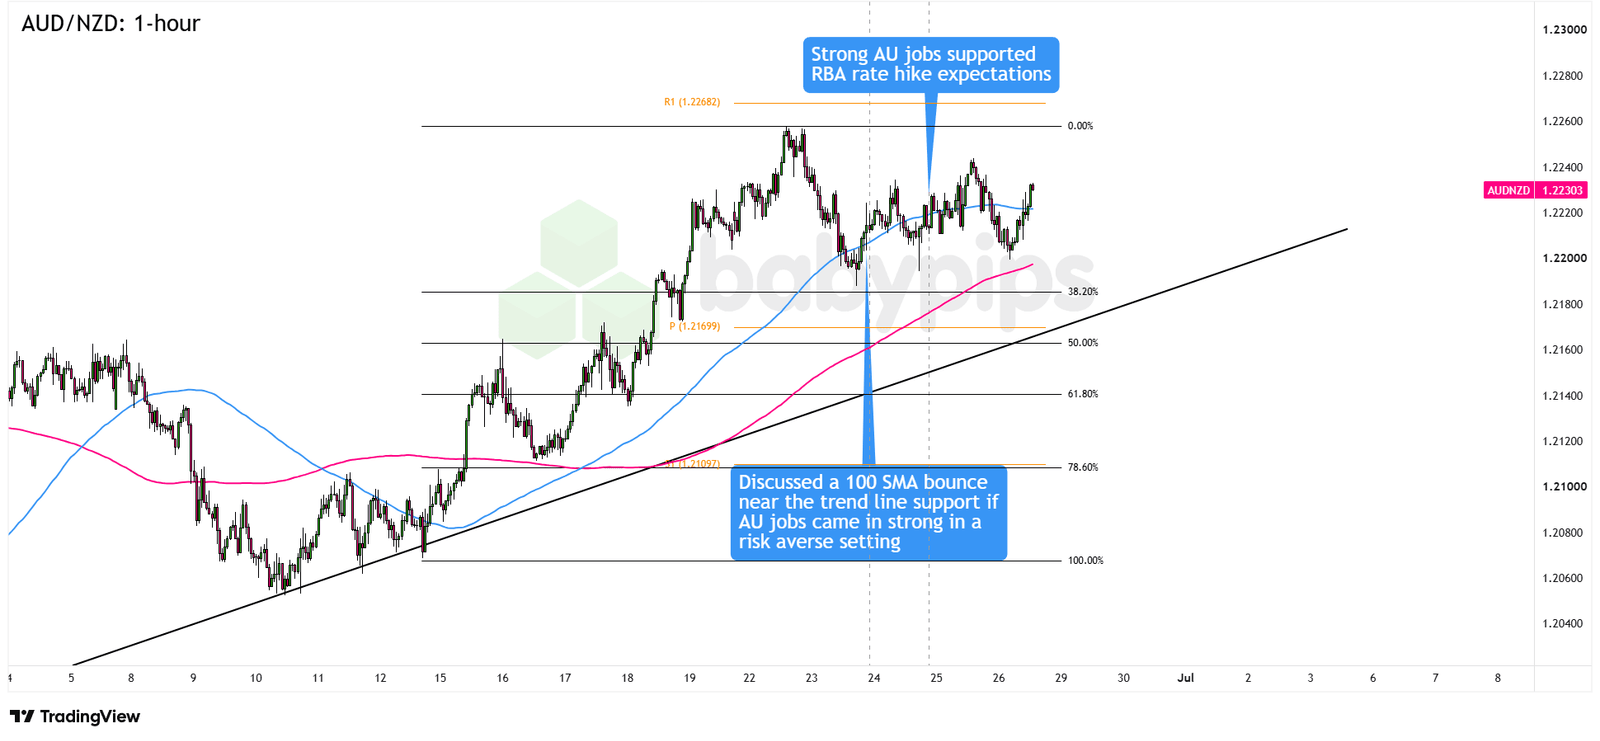
The AUD/NZD bullish setup needed two things: a strong Australia jobs beat and a risk-off backdrop where the RBA’s 4.35% rate still made AUD more attractive than NZD, with the RBNZ at 2.25%. The data condition was met. The environment was not: Micron’s earnings spillover pushed sentiment cautiously positive at the Asian open, and the setup did not qualify to move beyond the watchlist stage on its original terms.
That said, the trade still had a workable adapted case. AUD/NZD held its ascending trend line and the 38.2% Fib near the 1.2200 psychological level, then later reached R1 around 1.2270. The move was less about broad risk and more about the RBA and RBNZ rate gap. The initial reaction was mostly flat by the European open, which made sense since AUD and NZD share many of the same macro drivers. Hormuz tension, softer dollar action after PCE, and choppy equities kept follow-through uneven. But traders who entered closer to 1.2200 likely avoided a stop out and could have seen a positive result with patience.
Overall, the original setup was not triggered cleanly, but the adapted rate differential argument worked.
AUD/USD: Bearish AUD Event Outcome + Risk-Off Scenario
AUD/USD 1-Hour Forex Chart Faster with TradingView
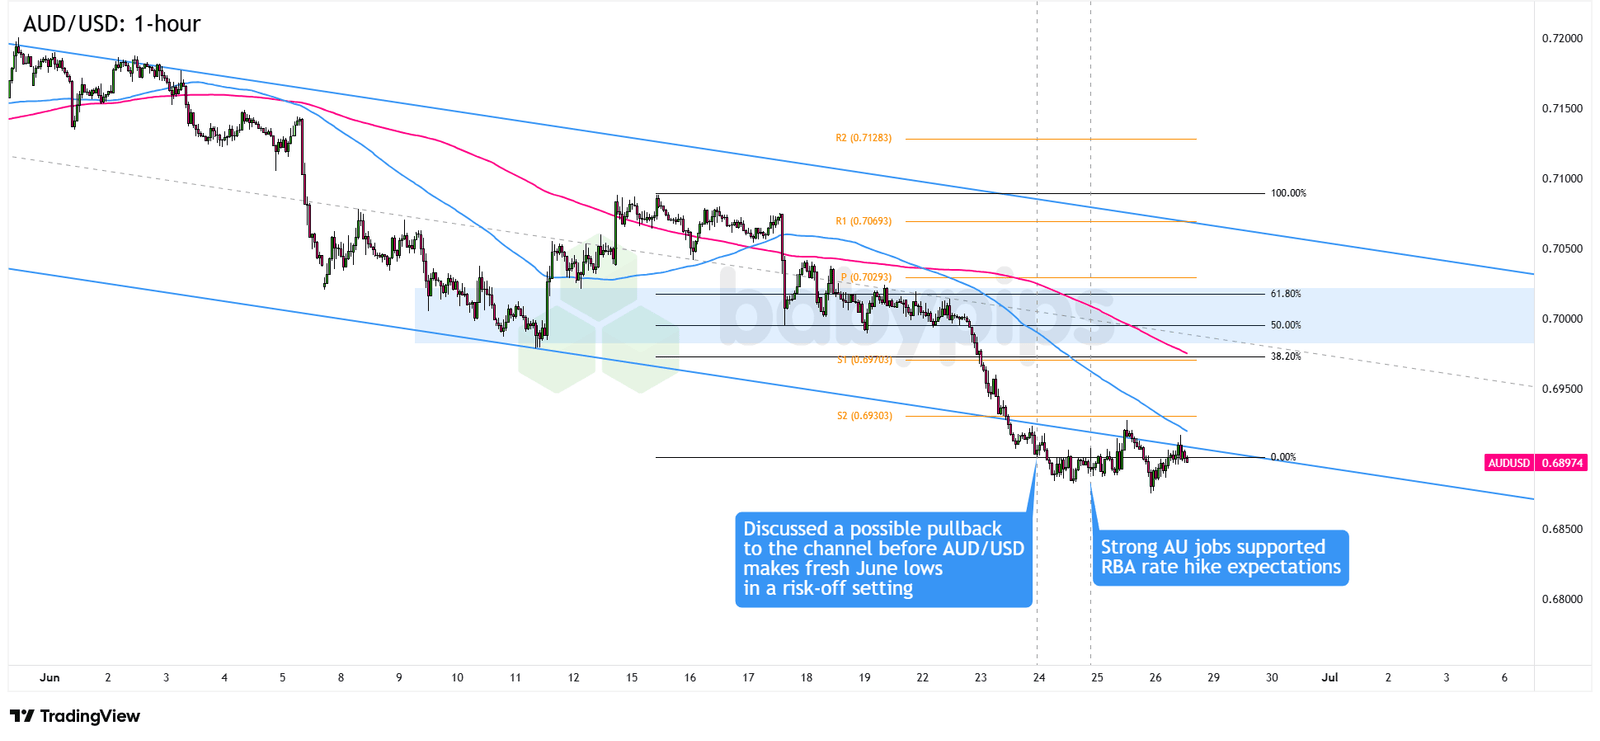
The bearish AUD/USD setup needed a jobs miss, risk-off flows, and dollar strength. The technical backdrop was already weak after the pair broke below a descending channel, with downside targets at 0.6930, 0.6850, and 0.6800. Sellers were watching 0.7000 and mid channel resistance as possible reload zones.
The trigger never came. The pair held above the S2 pivot level at 0.6930 and the broken channel support at the time of the release, leaving it not eligible to move beyond the watchlist stage.
Still, the pair traded heavily, falling 0.08% by the European open and ending near 0.21% lower even as the dollar softened after PCE. Traders looked past the headline beat and focused on the part-time heavy mix, weaker revisions, softer hours worked, and the broader Fed tightening story.
So the setup failed on the trigger but worked directionally. AUD/USD later made fresh June lows on composition-driven AUD selling, USD outperformance, and Friday’s Asia-driven risk-off cascade.
AUD/NZD: Bearish AUD Event Outcome + Risk-Off Scenario
AUD/NZD 1-Hour Forex Chart Faster with TradingView
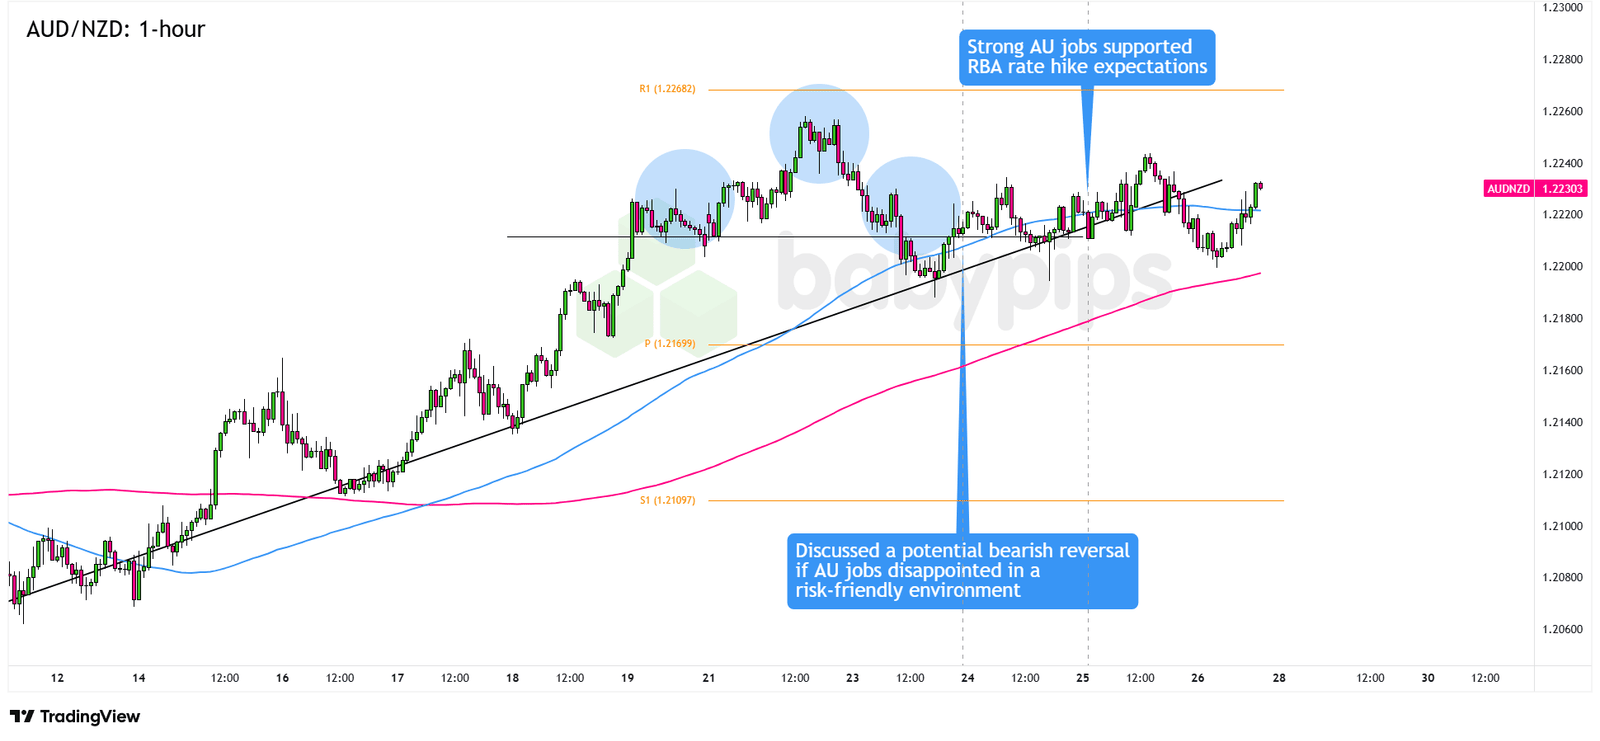
The employment report beat the headline forecast, preventing the bearish AUD/NZD setup from moving off the watchlist. AUD/NZD also didn’t break below the Head and Shoulders neckline flagged in the setup, and the strong jobs headline pushed the pair toward R1 at 1.2270 from the 1.2200 support area instead.
The setup had depended on a jobs miss, a more constructive risk backdrop, and NZD support from the RBNZ’s hawkish hold and New Zealand’s upbeat GDP print. None of that turned into a clean short case once the data landed.
The pullback from R1 in the sessions that followed also failed to reach the bearish targets at the 1.2170 pivot, the 200 SMA near 1.2150, or S1 at 1.2110. The RBA and RBNZ rate gap kept AUD supported against NZD through the week, and no adapted bearish case emerged after the original trigger was negated.
The Verdict
The week’s Australian employment watchlist produced a mixed but instructive outcome. The fundamental bias — bullish AUD on a headline beat — was correct. The beat itself was material. But the market’s reluctance to follow through cleanly on either AUD/CHF or AUD/NZD bulls reflected several overlapping forces: the part-time-heavy composition of the beat undercut confidence in RBA August hike pricing, the broader AUD had spent the week under pressure heading into the event, and the same Thursday session saw a U.S. macro data event (Core PCE) that hijacked the narrative for the second half of trading.
The most “arguable” positive outcome was AUD/NZD from the bullish side — the pair held its technical support, didn’t break the ascending trend line, and stayed alive as a longer-duration long idea. AUD/CHF found buyers at the .5600 floor as expected temporarily, but couldn’t generate the momentum toward the pivot and R1 that would have made this a cleanly profitable watchlist event due to the bearish shift in broad risk sentiment. AUD/USD bearish and AUD/NZD bearish were invalidated outright.
Overall: unlikely odds of a potential net positive outcome, given the low conviction outcome/reaction to the AUD jobs event, and a shift in the broad market environment towards risk-off stance at the end of week lead to a move lower in AUD/CHF and break of technical support.
Promoted: The Strategy is Half the Battle; Your Mindset is the Rest.
Most trading mistakes aren’t technical—they’re psychological. In the classic “Trading in the Zone” by Mark Douglas (⭐ 4.7★ | 10,000+ reviews on Amazon), you’ll learn how to master the probabilistic thinking and emotional discipline mentioned in today’s article. If you struggle with hesitation or breaking your rules, this is your manual for consistent execution.
Click on the link to learn more about “Trading in the Zone” by Mark Douglas!
Disclosure: To help support our content, we may earn a commission from our partners if you sign up through our links, at no extra cost to you.
Key Takeaways:
Headline Beats Don’t Always Buy You Follow-Through
A 40,300 print against 26,000 expected should have been a green light for AUD bulls. It wasn’t, at least not immediately. The composition mattered: 35,200 part-time jobs, declining hours worked, rising underemployment.
Traders read through the headline and questioned whether this print really shifted the RBA’s calculus. This is a reminder that in currency markets, the quality of a data beat can matter as much as the size. Always check what’s driving the headline number before anchoring your conviction too firmly to the top-line figure.
Application: When positioning around employment data, scan for hours worked and full-time vs. part-time breakdown before the release. These are the metrics that the central bank and sophisticated traders use to assess whether the labor market is genuinely tightening or just adding low-quality payrolls.
A Second Major Catalyst in the Same Session Can Override Your Setup
The Thursday session showed exactly why the Event Guide warned to “let the dust settle” after the jobs release. The U.S. Core PCE print at 8:30 am ET — hotter at 0.3% month-on-month versus 0.2% expected — created a separate, powerful force in currency markets.
The dollar sold off on buy-the-rumor, sell-the-news dynamics, potentially giving AUD crosses a second-wave lift that had nothing to do with the RBA or Australian labor market. If you had already exited or were stopped out before the PCE print, you missed a different kind of tailwind. If you stayed in trying to catch that wave, your thesis had effectively shifted from “RBA hike bets re-priced” to “dollar profit-taking.”
Application: When multiple top-tier catalysts fall in the same session, assign them different trading windows and manage accordingly. The Australian jobs setup was an Asia session trade. The PCE reaction was a U.S. session trade. Conflating the two in a single position muddies both the thesis and the risk management.
Technical Levels Still Earned Their Keep, Even in a Mixed Reaction
Despite the complicated fundamental read and the multi-directional cross-asset noise, the levels that mattered held. AUD/CHF defended the .5600/S1 zone through multiple intraday tests. AUD/NZD found buyers at the 38.2% Fibonacci near 1.2200, and the ascending trend line was not broken.
When fundamentals produce ambiguous outcomes, well-placed technical support often acts as the default anchor for positioning. The setups didn’t deliver home runs, but they didn’t blow up either — and that’s partly because the zones we identified were robust enough to absorb the volatility.
Application: In events where the data delivers a mixed beat (strong headline, weak composition), widen your mental model for what “supportive” price action looks like. A defense of support with a muted bounce is not the same as a failed trade. Sometimes the setup’s value is in telling you what not to do — and in this case, chasing AUD breakouts to new highs would have been the wrong call.
Australia’s May jobs report beat expectations, yet AUD pairs struggled to follow through — a reminder that how the market reads a data release matters as much as the number itself. Premium members can read our lesson:
📖 From Data to Price Action: What Happens When Big News Hits
Reading this helps you understand why an initial spike can reverse quickly, how algorithmic and analytical moves unfold in sequence after a release, and why the quality of a data beat shapes the market’s reaction as much as the headline figure.
And if you’re not a Premium subscriber yet, now’s a good time to sign up.
With Babypips Premium, you get full access to School of Pipsology lessons that help you understand not just what the price did after the data dropped, but why the market reacted the way it did and how to position around it next time.